
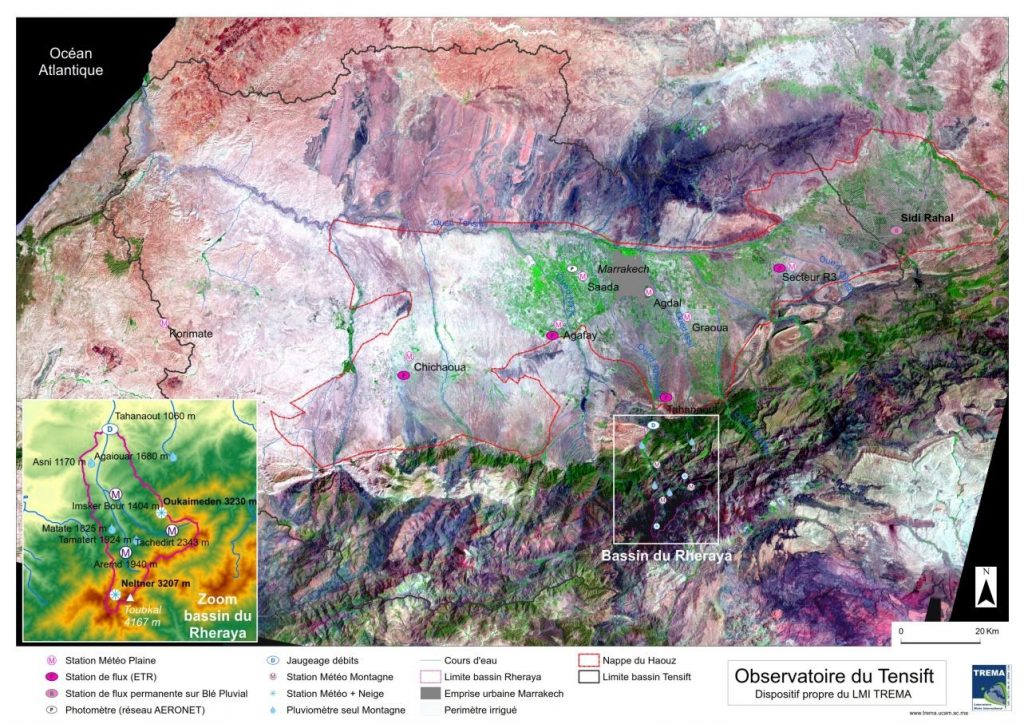
Tensift Observatory composed of monitoring stations in irrigated districts near Marrakech, and in the Rheraya sub-basin
Cosmic Ray Neutrons Sensing (CRNS) measurements
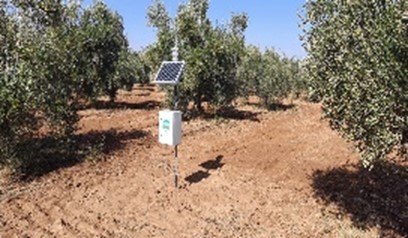
Recently, in the frame of IDEWA project, a cosmic ray neutron sensor (CRNS) was purchased and installed in Chichaoua, olive site. CRNS probe allow to count the neutrons and therefore to determine the water content present in the soil. CRNS allows the quantification of soil moisture over large areas and bridge the gap between point measure and satellite (the higher installation, the larger footprint).
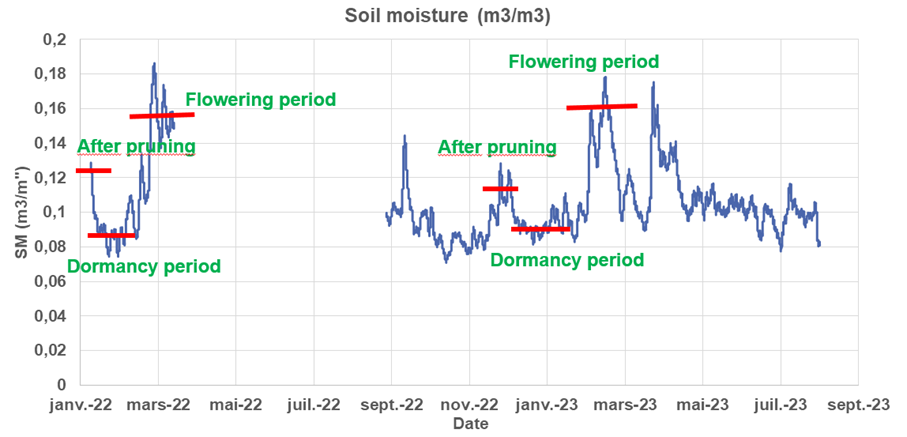
Such measurements could be also used to retrieve the soil moisture from the C-band radar measurements at high temporal frequencies over an olive orchard. Figure 1 shows the evolution of soil moisture measured by CRNS. This figure shows a clear variation in soil moisture in each stage of olives. The SM was lower during the dormancy period of olive because no irrigation was supplied by the farmer. After this period, when the olive starts the development, the soil moisture increases and reaches the maximum values during the flowering period when the farmer irrigates the plot frequently.
Water balance Water balance components monitoring: combining in situ data and crop modeling
Two lysimeters (G3) has been installed in two plot of irrigated olives orchards. The experimental field named ‘‘ Agdal’’ is almost flat, planted with 240-year old olive trees, grown in an orchard of about 275 ha. The density of olive trees was about 225 trees per hectare, which corresponds to an area of about 45 m2 occupied by each tree. The orchard was previousely surface-irrigated through level basin flood irrigation until 2014 when the irrigation is converted to drip irrigation with two types: superficial and buried. Each lysimeter has been installed in each irrigation type in order to evaluate the drainage water. The crop evapotranspiration and soil moisture at different depths were also installed in each plot (Figure 2).
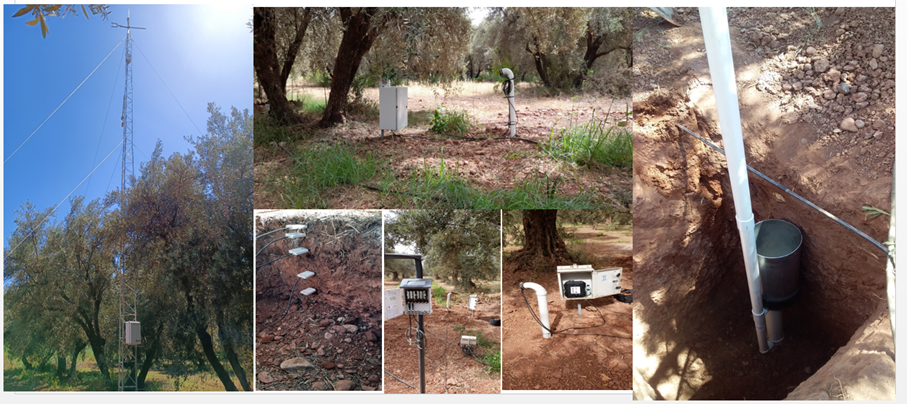
Figure 3 illustrates the seasonal variation of the daily evapotranspiration (ET) and crop coefficient (Kc) for “subDI” and “surDI” plots from May to November 2022. Note that we chose similar time steps between the two plots, so that the comparison between two systems of irrigation is meaningful and thorough. The ET varies between 1.3 and 6 mm for the “surDI” plot, with a maximum recorded in May. While the ET for the “subDI” plot fluctuates between 0.4 and 3.5 mm, with a maximum recorded in July. We note that the ET of “surDI” is greater than that of “subDI”, which is normally expected given that the subsurface irrigation system is designed to minimize the soil evaporation component.
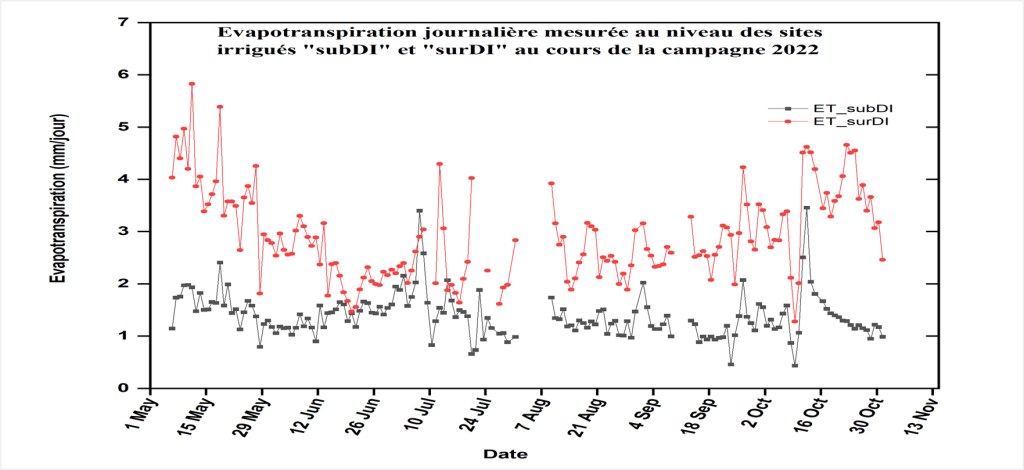
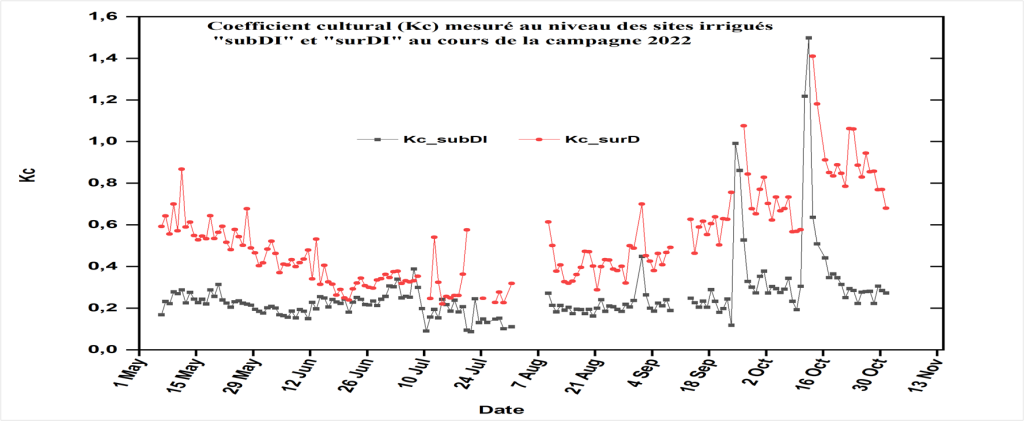
In order to evaluate the efficiency of each type of irrigation, we present the seasonal variation of crop coefficient (Kc), which is the fundamental parameter for determining crop water needs and for precision irrigation. The daily crop coefficient for two plots has been presented in the previous figure. As shown, the values of the Kc the “surDI” plot are generally higher than those of the second plot for the same climatic demand and for similar time steps. In fact, Kc varies between 0.1 and 1.4 for “subDI”, and between 0.2 and 1.5 for “surDI”. Indeed, in the plot “surDI”, the irrigation system delivers water directly to the soil surface, which can promote rapid soil evaporation, particularly in arid climatic conditions. This can lead to higher crop ET and then the higher Kc values. While for “subDI” plot, the irrigation system directly supplies irrigation water to the root zone, this can reduce the water requirements and the Kc coefficient values compared to the surface system.
Month 2024: Water balance Water balance components monitoring: simulation with Hydrus 3D model
HYDRUS-3D model is a public domain Windows-based modeling environment for simulation of water, heat and solute movement (Šimůnek et al., 2008). The model numerically solves the Richards equation for variably saturated media, and the convection–dispersion equation for heat and solute transport based on Fick’s law.
The water flow equation includes a sink term to account for root water uptake of plants. In the present study, this model was applied to predict the soil water movement at different depths, the main components of the water balance: plant transpiration, soil evaporation and deep percolation.
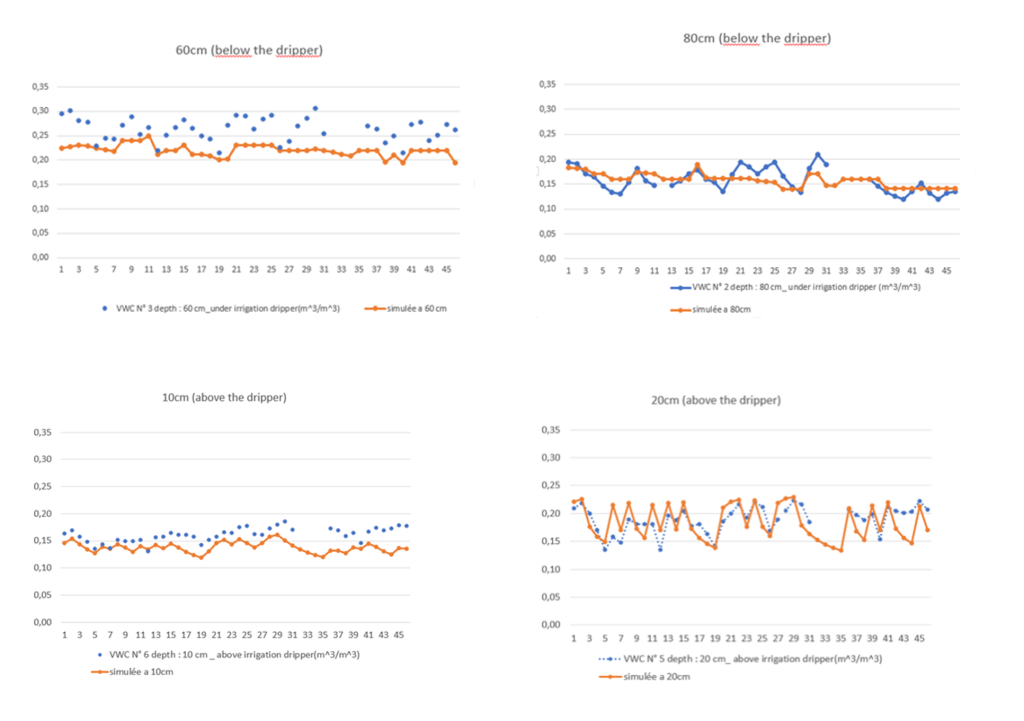
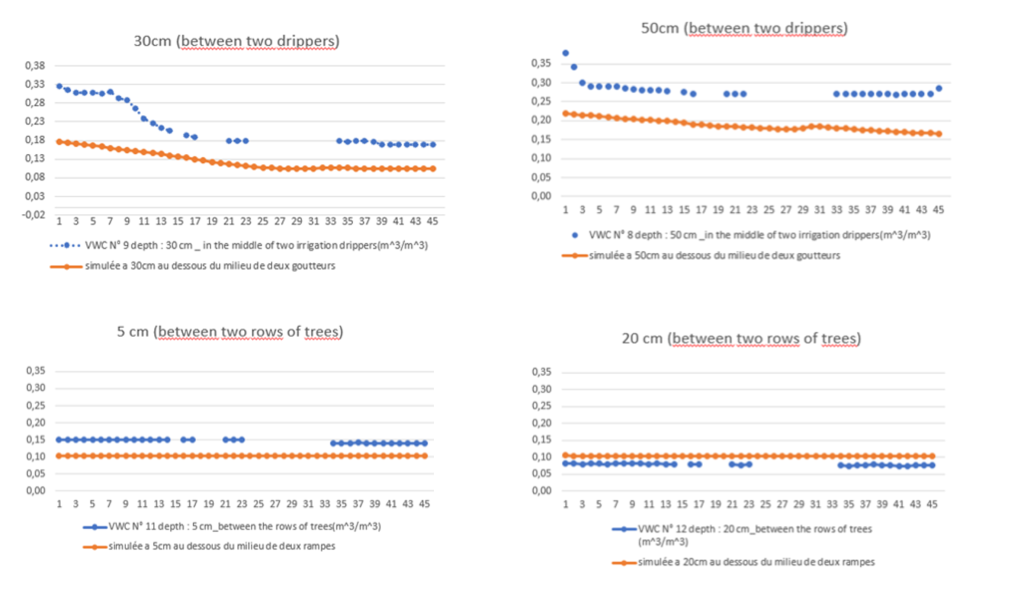
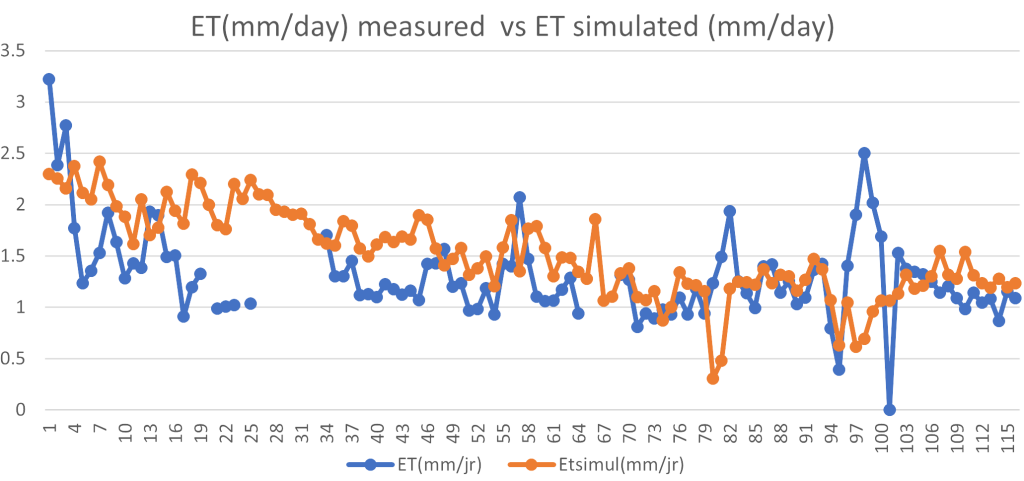
Figure 4 shows the comparison between measured and simulated soil moisture at different depths and different positions: below, above the dripper and between two drippers. According to this figure, the dynamics of soil moisture was adequately simulated and followed the trend of the measured values. As the dripper was installed in 30 cm depth, the soil moisture at 80 cm and 10 cm was lower and not changes much, meaning that there is a low percolation flux, and low capillary rise until 10 cm.
Regarding the soil moisture at 20 cm depth, both simulated and measured are higher and changes more, meaning that some capillary rise was occurred until 10 cm above the dripper.
The Hydrus 3D performance was also evaluated by comparing the measured and simulated actual evapotranspiration (ET) values (Figure 5). According to this figure, the model correctly simulates evapotranspiration. The evaluation and comparison of deep percolation between two drip irrigation system will be assessed.